
China’s Global Corporate Takeovers Turn Foreign R&D into Chinese Patents
China’s Global Corporate Takeovers Turn Foreign R&D into Chinese Patents [ 6 min read ]
INSIGHTS
- In a first-of-its-kind analysis, researchers trace ownership through offshore shells and estimate China’s firms controlled $2.1 trillion in foreign assets by 2021 ($3.3 trillion including Hong Kong and Macau), second globally only to the U.S. and on par with the UK.
- China investors, especially state-owned enterprises (SOEs), target R&D-intensive firms that already source from or sell to China. Nearly 80% of China-controlled international assets are in Europe and North America, and 38% run through tax havens like the Cayman Islands.
- After acquisition, target firms raise R&D by 7% and capital stock by 7%, but profitability falls about 1 percentage point, a pattern that is sharpest under SOE buyers and is absent from U.S. acquisitions abroad, which are more commercial and market driven.
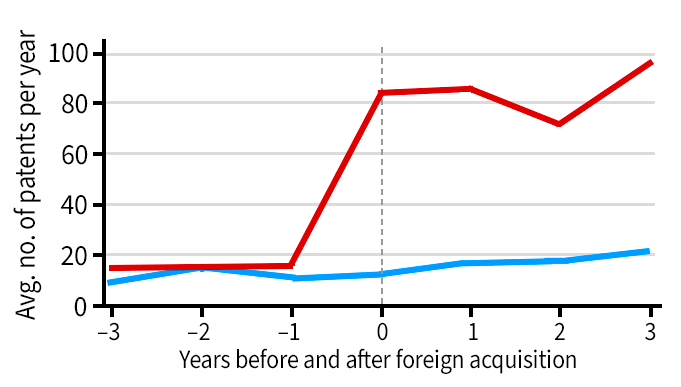
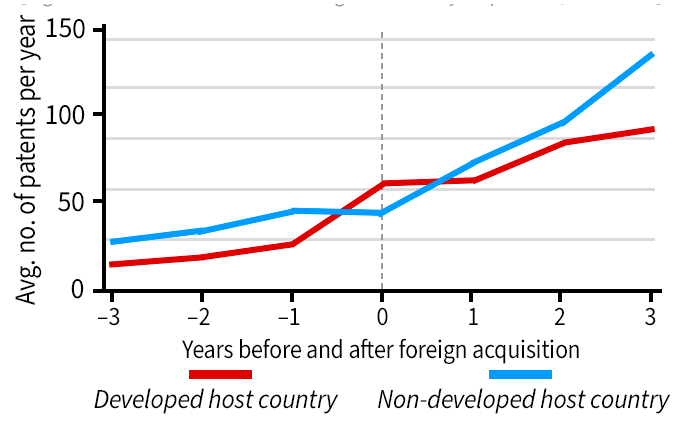
- None of that extra R&D shows up as patents at the acquired firm. Instead, patenting roughly triples at the parent firm in China after its first developed-country purchase (4.4-fold for SOE buyers), an “innovation spillback.”
- A larger Chinese ownership share in an industry cuts local rival R&D by roughly a quarter, though industry-wide patenting holds steady.
Source Publication: Jennie Bai, Luc Laeven, Yaojun Ke, and Hong Ru (2026). China’s Global Ownership. NBER working paper.
Read this brief on SUBSTACK
China’s outward investment has grown into one of the largest forces in global capital markets, expanding from about $317 billion in 2009 to more than $2.7 trillion by 2021, concentrated in advanced manufacturing, technology, and natural resources. These are sectors host governments increasingly treat as strategically sensitive. Much of this activity moves through multi-layered ownership chains routed via offshore financial centers, which official statistics are not built to trace, since they record only the immediate jurisdiction of an investor, not the firm’s ultimate owner. New research builds the most comprehensive micro-level dataset of China’s global corporate ownership to date, reconstructing that ownership from the ground up to answer two questions: how large has China’s overseas corporate footprint actually become, and what happens inside a foreign firm once China buys in.
The data. The study draws on Moody’s Orbis database, which reports ownership structures and financials for large companies worldwide, linked to global patent records and supply-chain relationships. Rather than relying on the database’s built-in ownership labels, the authors independently trace each firm’s ownership hierarchy layer by layer, an approach that uncovers roughly 15% more China-linked owners than the standard labels alone, mostly hidden behind offshore shells. This produces a panel of 161,773 very large firms across 159 countries from 2012 to 2021, covering more than 80% of global corporate assets. The authors then compare firms after acquisition by a Chinese firm (split into state-owned and non-state-owned buyers) to similar firms that were never Chinese-owned.
Second globally, and growing fast. Tracing ownership through offshore intermediaries reveals just how large China’s overseas ownership footprint has become. Chinese entities controlled roughly $2.1 trillion in foreign corporate assets by 2021 (about 3% of global corporate assets), up from $364 billion a decade earlier, an average annual growth rate of 20%. Including Hong Kong and Macau, “Greater China” controls $3.3 trillion in outbound corporate assets, on par with the UK‘s $3.2 trillion and trailing only the U.S.’s $9.3 trillion. Nearly 38% of Chinese-owned firms involve at least one intermediary in a tax haven such as the Cayman Islands or Bermuda, a pattern invisible to conventional foreign direct investment statistics, which record only the last stop capital makes, not its ultimate source.
Evolution of China’s corporate control
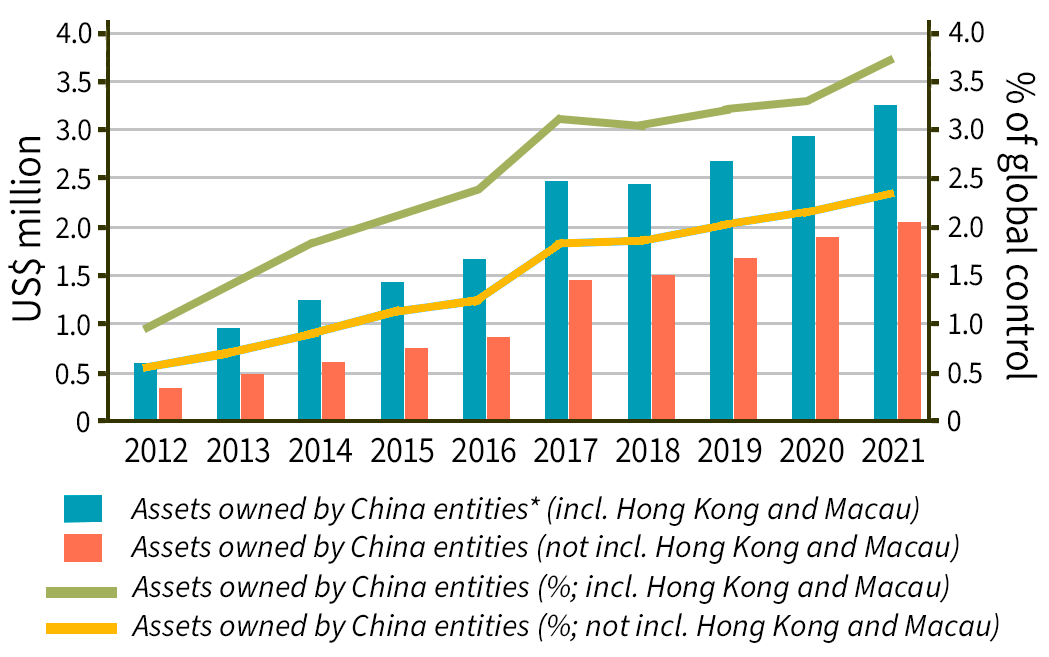
*Owned = controlling or largest shareholder >10% ownership is China entity
Evolution of U.S. corporate control
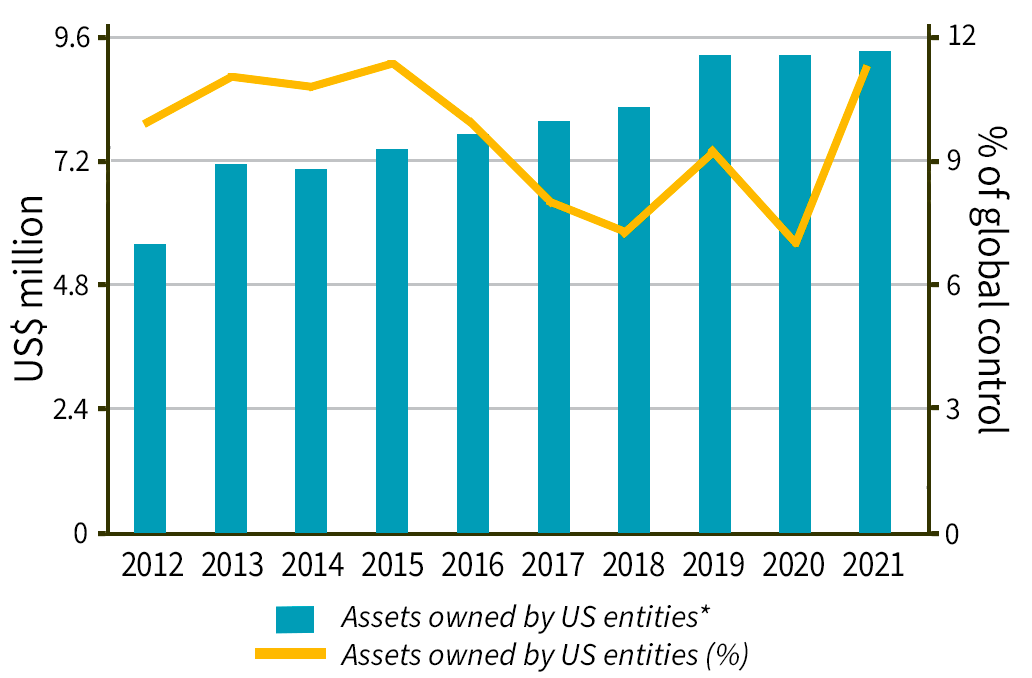
*Owned = controlling or largest shareholder <10% ownership is China entity
Boosting R&D at the expense of profitability. After a Chinese acquisition, target firms raise R&D spending by about 7% and capital stock by a similar amount, as the new Chinese owners redirect resources into these companies. Yet profitability, measured as return on assets, falls by roughly 1 percentage point on average. Both patterns are sharper when the acquirer is an SOE: SOE-owned targets see R&D rise about 29 percentage points more than under private Chinese ownership, alongside a steeper profitability decline. To confirm this reflects Chinese ownership itself rather than which firms China happens to buy, the authors examine China’s 2015 “Made in China 2025” initiative, which explicitly directed state firms toward acquisitions in 10 strategic sectors. Ownership in those sectors rose sharply after the policy’s launch, driven disproportionately by SOEs, and the newly acquired firms show the same signature: more R&D, more capital spending, and lower profitability.
The IP flows back to China. None of that extra R&D spending shows up as additional patents at the acquired firm itself. Instead, the authors find a sharp acceleration in patenting back at the Chinese parent company: in the year of its first acquisition in a developed economy, the parent’s own patent grants jump by roughly 204%, from about 21 to 64 per year on average, and by roughly 4.4-fold, from about 15 to 83, when the acquirer is an SOE. Acquisitions in non-developed countries show no such jump for either group. The authors call this an “innovation spillback”: evidence that intellectual property gains from these deals are captured at home in China, not in the country where the R&D dollars were actually spent.
SOE patenting activity in China after foreign acquisition
Non-SOE patenting activity in China after foreign acquisition
Rivals feel the squeeze. Chinese ownership also reshapes competition among firms never acquired at all. In industries where Chinese investors, particularly SOEs, hold a larger share of assets, non-acquired rival firms cut their own R&D spending by roughly a quarter. Yet across the industry as a whole, total R&D, patenting, and profitability barely change: the R&D that Chinese-owned firms add appears to offset what their rivals give up, thereby redistributing innovation activity toward Chinese-owned firms and away from their rivals, not shrinking in total.
Not just another foreign buyer. The analysis also shows that this pattern stands out as unique to China’s firms. The same regressions applied to U.S., Japanese, and Indian acquisitions reveal a more market-driven picture: American investors expand target firms’ scale without denting profitability, Japanese acquirers show a milder version of China’s pattern but without the state-driven intensity, and Indian investors barely change target firm behavior at all. Chinese SOEs alone accept measurable short-term losses in exchange for long-term control over where innovation ends up. These findings feed into a broader debate over geoeconomic influence and the future of global innovation: when China’s state-backed capital crosses borders, the evidence suggests it is acting as an instrument of national industrial policy, one that may quietly weigh on productivity in host economies while building up technological capacity back home.