From Made in China to Made by China: Industrial Policy and the Rise of China’s Domestic Value Added
From Made in China to Made by China: Industrial Policy and the Rise of China’s Domestic Value Added [ 5 min read ]
INSIGHTS
- Analysis of trade data from 2007 to 2020 shows domestic value added (DVA) — the share of export value created within China — rose from 66% to 76%, driven by a sharp drop in processing trade (assembly of imported parts for re-export) from 41% to 23% of exports.
- Private firms are leading the shift: their DVA share climbed from 76% to 81% as they expanded to 55% of total exports, while state-owned (15%) and foreign-invested firms remained more reliant on imported inputs.
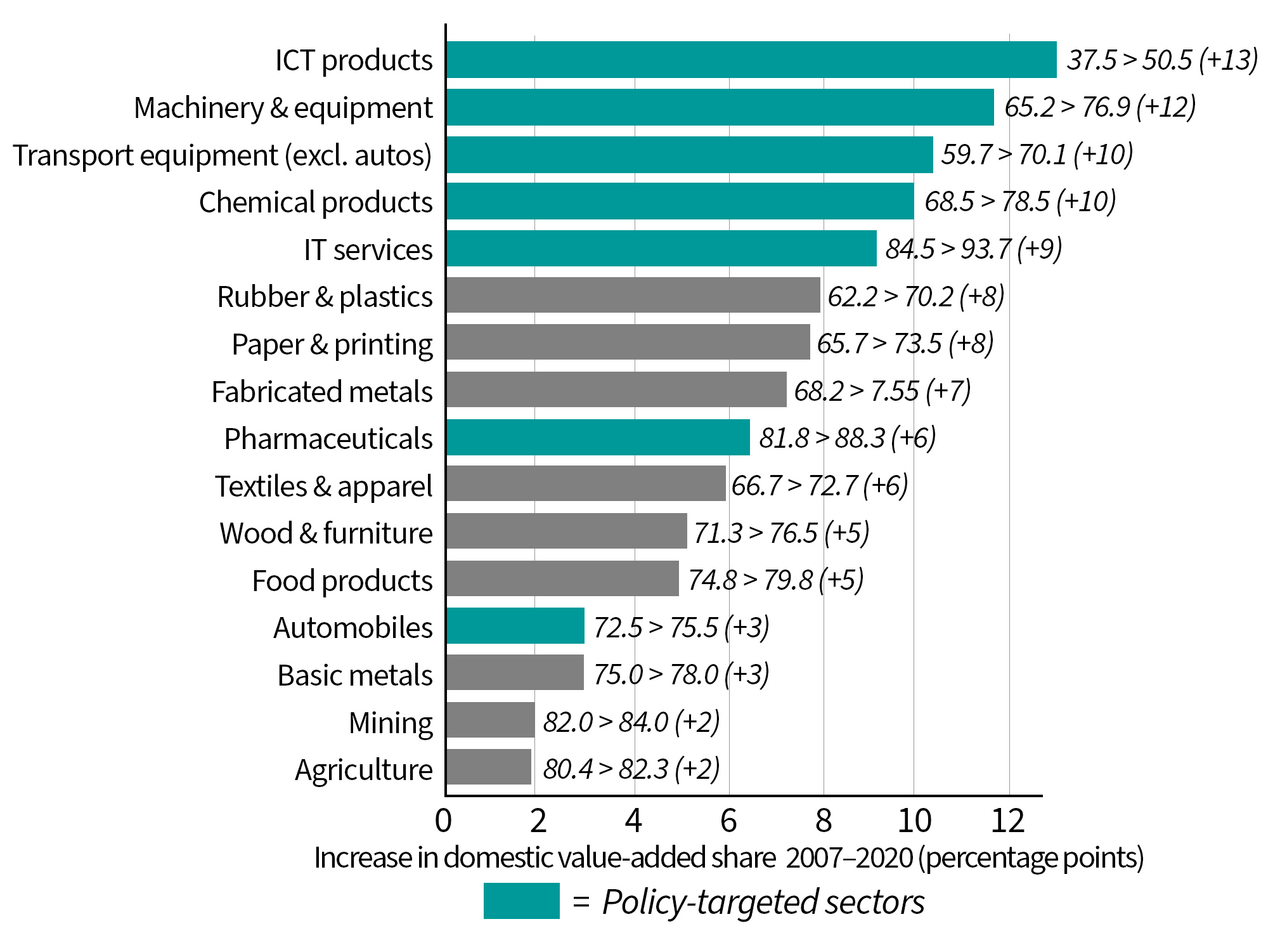
- Policy-targeted sectors under Made in China 2025 (e.g., ICT, machinery, chemicals, and transportation equipment) saw 7-13 percentage-point DVA gains, outpacing other industries.
- Econometric analysis shows policy-backed sectors averaged 2% higher DVA shares than others, confirming that industrial policy raised domestic content, though the study does not assess its cost.
Source Publication: Kun Cai, Zhi Wang, and Shang-Jin Wei (2025). Industrial Policy and Domestic Value Added in Production and Exports: The Chinese Experience. The World Economy.
Read this brief on SUBSTACK
China has launched a wave of industrial policies aimed at keeping more value creation at home rather than abroad. Programs such as the Strategic Emerging Industries Plan (2010), Made in China 2025 (2015), and the 13th and 14th Five-Year Plans for manufacturing and innovation all emphasize boosting the domestic share of production, reducing dependence on foreign inputs, and climbing the global value chain. These policies channel subsidies, credit, and procurement preferences toward sectors like information technology, advanced machinery, new materials, and electric vehicles — industries seen as essential for technological self-reliance. Did industrial policy increase the domestic value added (DVA) in China’s exports?
The data. To measure how much of China’s export value is created at home, the authors use national input-output (IO) tables for 2007, 2012, 2017, 2018, and 2020, which map how every sector of the economy buys from and sells to every other sector. They then divide exports into ordinary trade, produced mainly with domestic inputs, and processing trade, where imported parts are assembled for re-export. By constructing an extended IO system that explicitly tracks processing activity — drawing on Chinese Customs and UN trade data — the authors estimate the DVA share for each sector and year. They then link these measures to industries covered by national industrial policy frameworks such as Strategic Emerging Industries and Made in China 2025 and compare DVA growth in policy-supported versus non-supported sectors.
DVA has risen steadily. China’s DVA in exports rose steadily from 66% in 2007 to 76% in 2020, driven mainly by a sharp decline in processing trade — exports assembled in China from imported components for re-export — which fell from 41% to 23% of total exports. Within the remaining processing exports, however, the domestic share of value added stayed roughly constant at 39-40%, meaning these activities continued to rely heavily on imported inputs. In contrast, non-processing trade, where firms produce mainly with domestic materials, saw only a modest DVA increase of about 1.5 percentage points. Overall, the data show China’s export structure shifting away from low value-added assembly toward more domestically integrated production.
Private firms lead; foreign-invested firms lag. China’s private firms have become the main drivers of China’s export upgrading. By 2020, they accounted for 55% of all exports and recorded the highest DVA share, around 81%. In contrast, foreign-invested enterprises still depend heavily on imported inputs — more than half of their exports remain processing trade — though their DVA shares began to rise after 2017, suggesting that policy-driven efforts to promote import substitution and local sourcing started to take effect later in the period.
Change in DVA by sector
Exports to rich countries have less domestic content. China’s exports to OECD countries — a group of mostly high-income economies, including the U.S., Japan, and members of the European Union — contain only about 68-72% percent DVA, compared with 75-82% for exports to emerging and developing economies. After 2018, China’s firms used a somewhat higher share of domestic inputs (and a smaller share of imported components) in their processing exports, a shift likely driven by a combination of Made in China 2025 policies, which encouraged local sourcing, and the U.S.-China trade conflict, which disrupted global supply chains and prompted firms to rely more on domestic inputs.
Industrial policy modestly boosted upgrading. High-tech and strategic industries recorded the biggest gains in DVA between 2007 and 2020. Information and communcations technology (ICT) products rose by 13 percentage points, machinery and equipment by 12, and transport equipment and chemical products by about 10 each, while pharmaceuticals and IT services gained 7-10 percentage points. Because these sectors overlap closely with Made in China 2025 priorities, the pattern points to policy-driven upgrading rather than a natural market shift.
To test this directly, the researchers compared policy-supported industries with similar sectors left outside official plans, controlling for differences in processing trade, skill intensity, capital use, output, and import tariffs. They find that policy-backed sectors averaged about 2% higher DVA shares, a statistically significant gap. Industries more reliant on processing trade consistently showed lower domestic content, confirming that moving away from assembly-based exports helped raise DVA.
Success, but at an unknown cost. The findings suggest that China’s industrial policies have succeeded in their stated goal of deepening domestic production. Between 2007 and 2020, the share of DVA in exports rose by roughly 10 percentage points, with the largest gains concentrated in policy-targeted, high-tech sectors. China is capturing more of the value chain at home, especially in strategic industries. Yet the study does not estimate the fiscal cost or efficiency trade-offs of these policies — subsidies, resource misallocation, or potential productivity losses. In short, the analysis shows that industrial policy worked in raising domestic content, but not at what cost.